Make emitted JSON-LD visible, traceable, and debuggable
- ViewerInspect emitted route output and verify exactly which JSON-LD objects are present.
- GraphTrace relationships and references across the final JSON-LD output.
- Context-Aware DebuggingSeparate current-path, global, and other objects at a glance.
- ExplorerLook up schema types and properties while debugging emitted output.
- ValidationSurface structural issues in emitted JSON-LD during inspection.
- Rich Results PreviewPreview how route output maps to rich-result-relevant output.
- Live JSON-LD SynchronizationKeep JSON-LD objects in Viewer, Graph, and diagnostics synchronized with code changes during development.
- Integrated MCP ServerLet AI tools inspect graphs, explain objects, check diagnostics and compare routes.
- TypeScript IntelliSenseBuild schema.org objects with typed properties and editor autocomplete.
Nuxt JSON-LD Debugger is built and maintained by Armin Kunkel, listed as a contributor to Nuxt SEO.
When multiple sources emit JSON-LD, the final output gets harder to verify.
Nuxt modules, global defaults, and manual additions can all contribute JSON-LD. The debugger helps you inspect final route output, follow references, and verify object context in one place. Live synchronization keeps the JSON-LD objects aligned with your code changes during development.
- Viewer — inspect emitted JSON-LD objects per route
- Graph — trace relationships and references visually
- Context markers — separate current-path, global, and other objects
- Explorer — look up schema types and properties while you debug
- Validation — surface structural issues during inspection
- Rich Results — preview rich-result-relevant output in the same workflow
- Live synchronization — updates JSON-LD objects during development
- MCP — inspect objects, references, diagnostics and more with AI tools
See route output and relationships in one debugging workflow
Start with emitted route output in Viewer, move into relationships in Graph, and query the same debugging state through MCP. During development, live JSON-LD synchronization keeps these views aligned with your code changes.
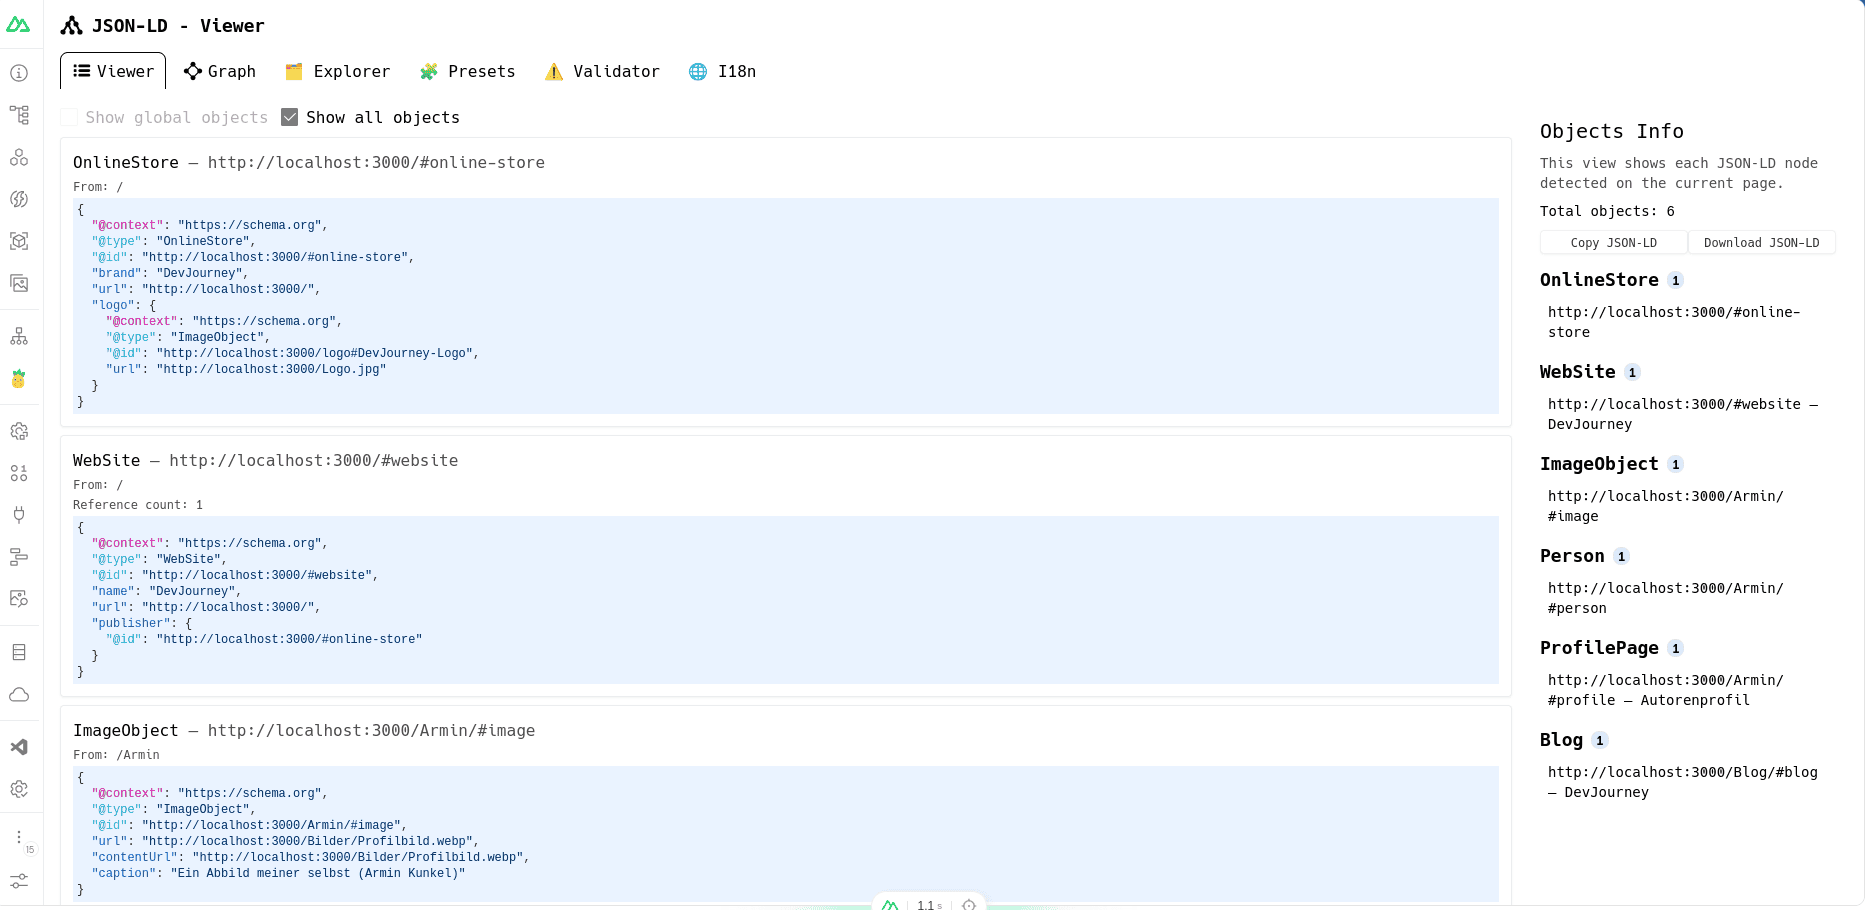
Inspect emitted route output while visible JSON-LD objects stay synchronized with code changes during development.
- Verify the exact objects emitted for the current route.
- Inspect raw object details without guessing from source code.
- Check object scope before debugging deeper.
- Confirm what is actually present on the page.
- Everything in Core
- Up to 15 projects per year
- Current path vs Global vs Other objects
- Viewer Tab
- Graph Tab
- Schema Explorer
- Presets Tab
- Live JSON-LD in development
- Integrated MCP server
- Bug fixes / Updates
Solo pays for itself if it saves around 2 hours per month.
- Everything in Solo
- Up to 30 projects per year
- Team usage
- Email support
Pro pays for itself if it saves around 3 hours per month across all projects.
- Everything in Pro
- Unlimited client projects
- Priority bug fixes
- Repeatable structured data QA
- One debugging workflow
- Reduce handoff time
Agency pays for itself if it saves around 4 hours per month across all projects.
Built for repeatable structured data QA across client projects
Turn recurring JSON-LD investigations into a consistent workflow your team can apply across projects.
When a client reports structured data issues, your team should not search through source code, rendered HTML, external validators, and route states separately.
Inspect the emitted graph, trace relationships, check object scope, and hand off findings faster with the same Nuxt DevTools workflow on every client project.
Let AI tools summarize route graphs, compare outputs, and explain diagnostics for faster handoff inside the team.